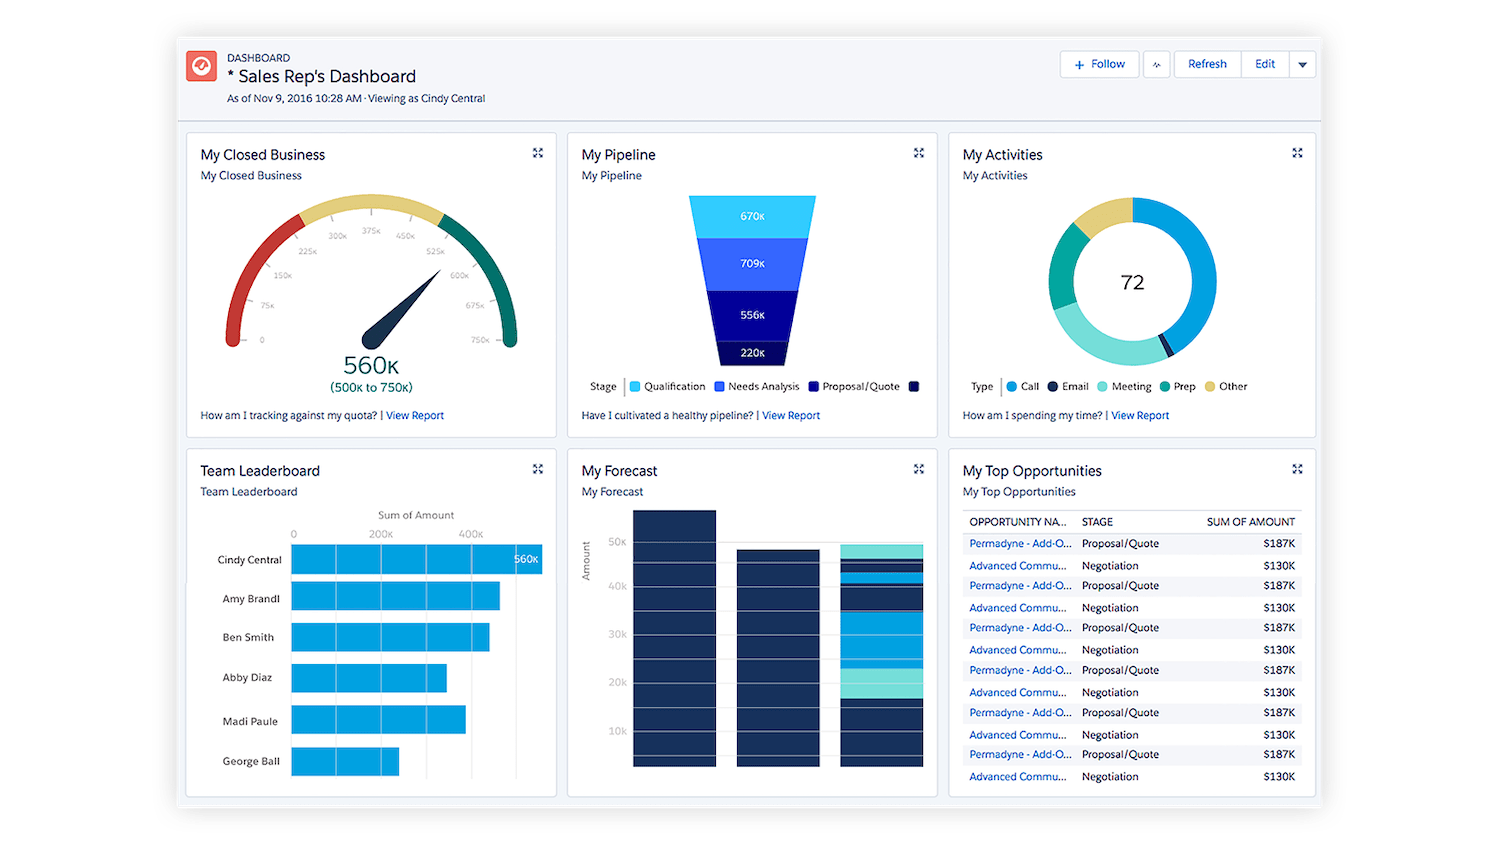
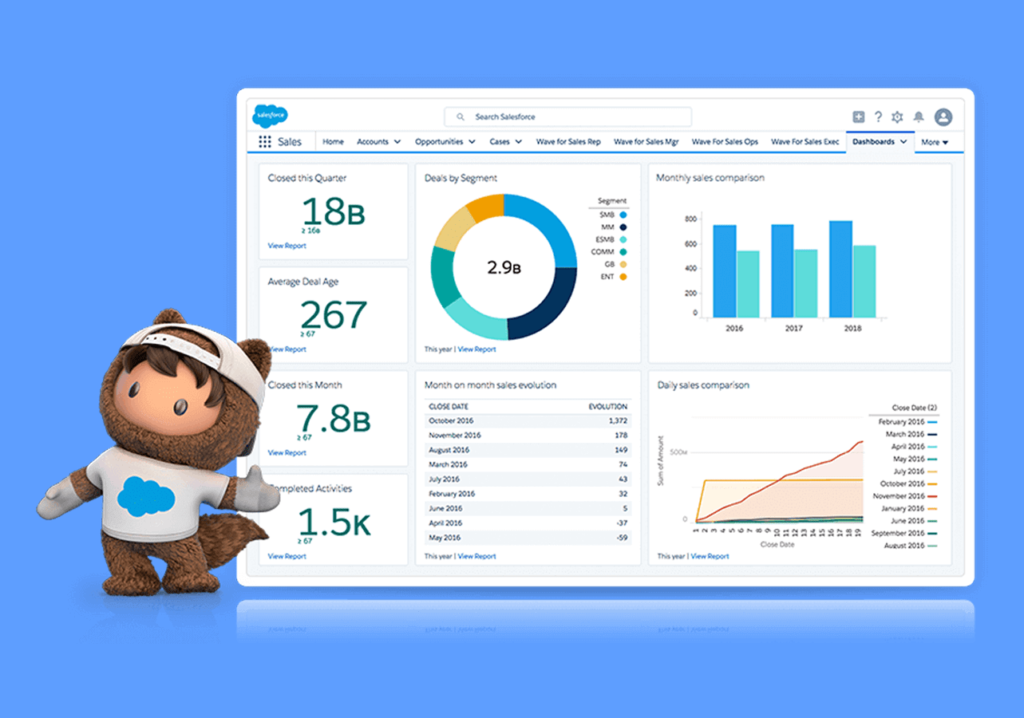
Salesforce Dashboards provide an excellent way to visualize data, monitor key performance indicators, and drive informed business decisions. Constructing a dynamic Salesforce dashboard might sound wading, and I have some steps that help you create dashboards that give you the most valuable insights and are easily understandable. There comes the role of the Salesforce Dashboard. In this web journal, we will guide you in creating a powerful salesforce dashboard.
What are Salesforce Dashboards?
Salesforce Dashboard Concept
A Salesforce dashboard provides a snapshot of a business state. The Salesforce dashboard contains the form of a graphical representation of your business model. It consists of several components that create stories, including tables, gauges, graphs, charts, and more. It also tells you how your organization is performing as a whole. you need to be able to track what is going on to make progress and create real data to make decisions with – dashboards.

Why to utilize Salesforce Dashboards?
Tableau can be considered as the consolidated and updated version of the Salesforce Dashboards that serve the following benefits:
- Dashboards And Real-Time Data Representation – Using dashboards, gives you real-time information, hence you can make decisions quickly.
- Personalization – You can create dashboards that are as unique as your company. Easy to understand and navigate to the users.
- Easy communication – Group members can easily share dashboards, enabling them to collaborate.
Building a Strong Salesforce Dashboard:
Building an efficient Salesforce dashboard by following the below steps: Now let’s break down each final step.
1. Define your objectives
Before you start designing your Salesforce dashboard, consider the following questions.
- What is the Goal of the Dashboard?
- Who is going to use the dashboard?
- How can you instruct KPIs on your business and make it Data-driven?
It will keep you focused on what is important and what is not and thus help you set goals to get the perfect dashboard that is tailor-made for your use.
- Gather and Prepare Your Data
Good data is important to have a good, powerful dashboard Ensure your data is Truly Valid, Unique, and Accurate. Consider the following steps:
- Collect data: Determine the sources of data inputs you require for your dashboard. This may include your salesforce objects, external source data, or custom reports.
- Data scrubbing: To ensure data integrity, remove any data that is obsolete, redundant, or not in use.
- Integration of data: Data integrated among different needs when required.
- Use the Correct Components on the Dashboard
Salesforce provides several types of dashboard components that enable you to create different types of visualizations. These include:
- Graphs: It consists of many graphs like – Bar, line, pie, etc.
- Tables: To see the information in a table view compared to visuals.
- Custom Visualforce components: Developed as components using Visualforce pages.
Select which components will best serve your data and insights.
- Design Layout for your Dashboard
Imp Note: A visually appealing layout sets the foundation for a strong dashboard. Consider the following tips:
- Make it Simple: Stick to the simple and high-level, important metrics that are easy to understand
- Have uniform colors: We can use a color scheme that aligns your business throughout the dashboard to make it easy to read.
- Compose related components: Gather the components in such a way that creates sense and stream well.
- Highlight the most important details: Place the most vital information at the top of the dashboard
- Personalize Dashboards: Set Your Filters
Filters help users to communicate with the table data and view it from different angles on the dashboard. In the Filter criteria options of the Salesforce way of doing the same, salesforce provides different filter options like
- Filter through Date: To filter data on specific date ranges.
- Filter through Users: Show data belonging to particular users or teams using user filters.
- Filter through fields: Data filtered by specific fields or criteria.
Add a filter that fits your needs and aligns with your use case, and explore more data through filters.
- Push your Dashboard Notifications
You can also create notifications within your dashboards in Salesforce. This functionality can make you like to share with the rest of the events that happen with the code to inform the team of any changes. Additionally, you can establish notifications to tell you when particular metrics are reached so that you will never miss important news.
- Share Your Dashboard
After your dashboard is done it is time to share it with your team There are a few ways you can share dashboards with Salesforce:
- Public: Allows all users in the organization to access your dashboard.
- Restricted dashboards: These are made private to selected users/groups of users.
You can schedule the report Licensed separately and Using Send email to the right people in intervals with the dashboard image for email, Dallas, etc.

Pro Tips for Creating a Powerful Salesforce Dashboard
There are more than just following these steps to create an awesome Salesforce dashboard. There are some more ideas to spice up your dashboard
Focus on Key Metrics: Which metrics should matter for your business most, and cut everything else. When your dashboard becomes too cluttered with information, creating a less impactful dashboard experience.
Test Your Dashboard: Test your dashboard until you can deliver it to more than one audience. How to Validate that all the components are displayed properly and the data is valid? Test it with a few numbers of users and then iterate on it as needed.
Easy to Understand: Before creating a dashboard make sure that it is easy to understand no jargon available, and help with the clear description. Your objective should be to make a dashboard that is simple and easy to understand.
Conclusion:
You must have a clear adaptation of what you want to show on your dashboard. You must check if the available data is important to you, and organize it viably in a mannered way. By following these steps guide, you can create a data-driven dashboard, that will enhance your business decisions, and support your business objectives. Remember that spending time and maintaining a well-designed dashboard – lets you evolve with your business. Verify and update your dashboard regularly to ensure its relevance as a valuable tool for your organization. Best of luck to you Happy Dashboarding!
Have a look – HERE
Must Visit – My Blogs
- Mayank Sahuhttps://salesforcetrail.com/author/mayank-sahu/
- Mayank Sahuhttps://salesforcetrail.com/author/mayank-sahu/
- Mayank Sahuhttps://salesforcetrail.com/author/mayank-sahu/
- Mayank Sahuhttps://salesforcetrail.com/author/mayank-sahu/July 17, 2024


